What is Pandas? Why do we need to use it?:
. Pandas is a Python library used for working with data sets.
. Pandas allows us to analyze big data and make conclusions based on statistical theories.
. Pandas can clean messy data sets, and make them readable and relevant.
. Relevant data is very important in data science.
1. Watch this one-shot tutorial alongside for a better understanding.

2. Install Pandas and Verify it:
pip install pandas

print(pd.__version__)

# It can also be installed through your system's terminal
3. Import pandas:
import pandas as pd4. Pandas Data Structures:
4.1 Series:
import pandas as pd
a = [1, 7, 2] # List

myVar = pd.Series(a, index=["a", 'b', "c"])

print(a[0])
print(myVar["a"])

# Index access by column index
print(myVar[1])

a = [1, 7, 2]
myVar = pd.Series(a, index = ["x", "y", "z"])

print(myVar)
print(myVar["y"])

calories = {"day1": 420, "day2": 380, "day3": 390}
myVar = pd.Series(calories)
print(myVar)

print(calories["day2"])
print(myVar["day2"])


calories = {"day1": 420, "day2": 380, "day3": 390}
myVar = pd.Series(calories, index = ["day1", "day3"])
print(myVar)
4.2 Dataframe:
import pandas as pd

data = {
    'Name': ['Alice', 'Bob', 'Charlie', 'David'],
    'Age': [24, 27, 22, 32],
    'Salary': [50000, 60000, 55000, 70000]
}

df = pd.DataFrame(data)
print(df)

print(df['Salary'])
print(type(df['Salary']))

print(df['Salary'][0])

print(df['Salary'].cumsum())

series1 = df['Salary']
print(series1[series1 > 60000])
4.2.1 Access and Manipulate Data in a DataFrame:
import pandas as pd

data = {
    'Name': ['Alice', 'Bob', 'Charlie', 'David'],
    'Age': [24, 27, 22, 32],
    'Salary': [50000, 60000, 55000, 70000]
}

df = pd.DataFrame(data)
print(df)

print(df.loc[0])

data = {
    'Name': ['Alice', 'Bob', 'Charlie', 'David'],
    'Age': [24, 27, 22, 32],
    'Salary': [50000, 60000, 55000, 70000]
}

df = pd.DataFrame(data, index=['a', 'b', 'c', 'd'])
print(df)

print(df.loc['a'])

print(df.loc['a', 'Salary'])

print(df[df['Age'] > 25])

print(df.iloc[1])

print(df.iloc[0, 2])
4.2.2 Adding or Modifying Data in a DataFrame:
data = {
    'Name': ['Alice', 'Bob', 'Charlie', 'David'],
    'Age': [24, 27, 22, 32],
    'Salary': [50000, 60000, 55000, 70000]
}

df = pd.DataFrame(data, index=['a', 'b', 'c', 'd'])
print(df)

df.loc['e'] = ['Charlie', 35, 50000]
print(df)

df['Age after 10 years'] = df['Age'] + 10
print(df)
4.2.3 Working with a CSV file using Pandas:
path = "../Data/" # Copy the path of the csv file

file = path + 'Customer Purchase.csv'

import pandas as pd
df = pd.read_csv(file)

print(df.head())

print(df["Age"].isnull().sum())
print(df["Education"].isnull().sum())

print(df.isnull().sum())

print(df.isnull().sum().sum())

print(df.head(20))

rows_with_missing = df[df.isnull().any(axis=1)]
print(rows_with_missing)

# df_dropped = df.dropna()
# df_dropped = df.dropna(how='all')

# df_dropped_columns = df.dropna(axis=1)
# df_dropped_columns
# df_dropped_columns = df.dropna(axis=1, how='all')

df_filled = df.fillna(0)
print(df_filled.head(20))

df2 = df
df2['Review'] = df2['Review'].fillna(df['Age'].mean()) # avg
df2['Education'] = df2['Education'].fillna(df['Age'].median()) # the middle number
df2['Purchased'] = df2['Purchased'].fillna(df['Age'].mode()[0]) # number that appears most
print(df2)

# Save to CSV
df2.to_csv(path + 'output.csv', index=False)

# Save to Excel
df2.to_excel(path + 'output.xlsx', index=False)
PRACTICE QUESTIONS:
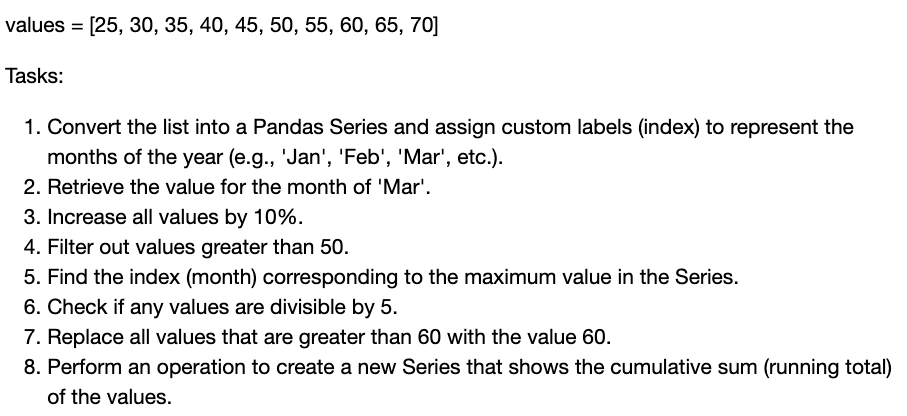
Q1. Create a Pandas Series from the following list of values and then, perform the following tasks.
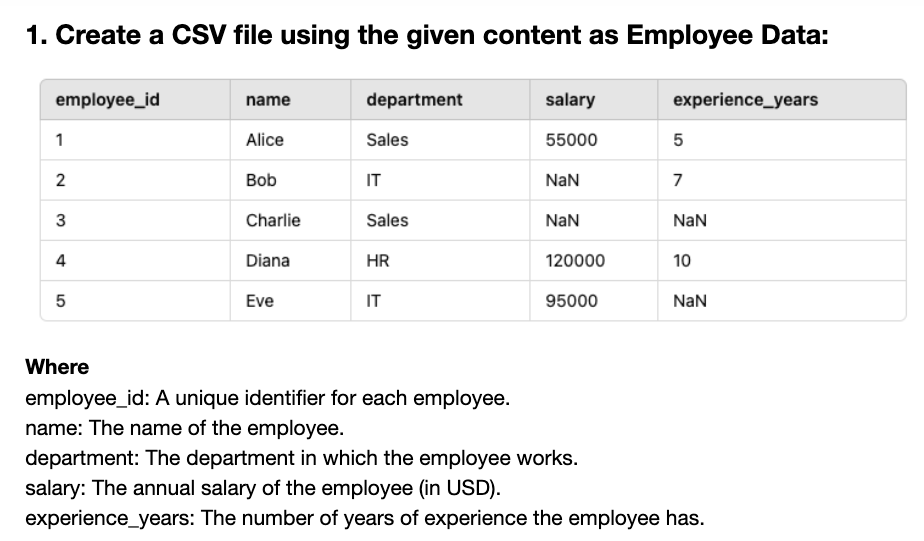
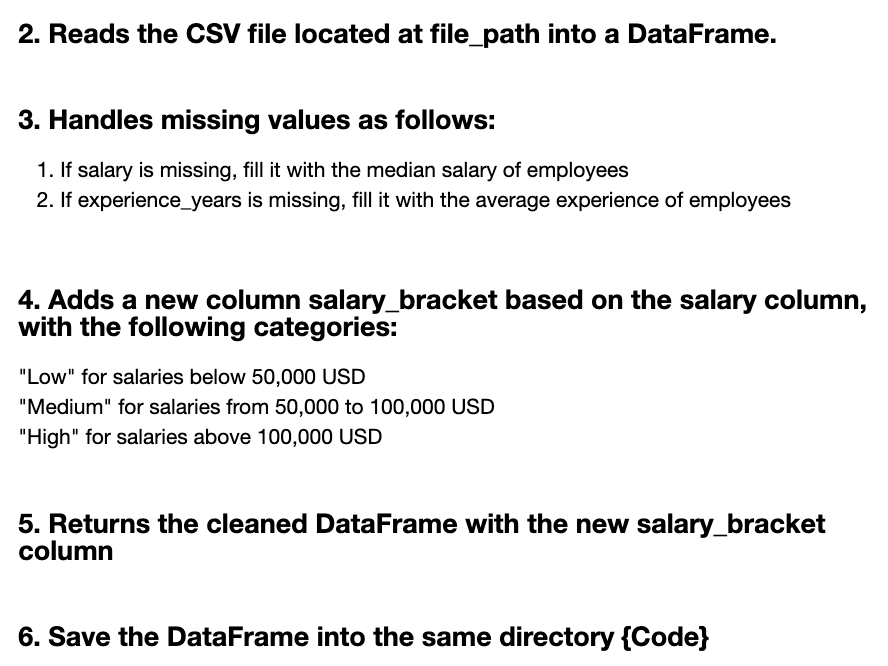
Q2. Perform given operations using Pandas.DataFrame.
These questions are for practice, and the corresponding codes and answers have been intentionally omitted. Try solving them on your own first, and if needed, watch the video for the correct answers.
In [12]:
import pandas as pd

df = pd.read_csv("ipl2024 Matches.csv")
print(df.head())
   id           date      team1      team2 toss_winner decision  first_score  \
0   1  March 22,2024   Banglore    Chennai    Banglore      Bat          173
1   2  March 23,2024      Delhi     Punjab      Punjab    Field          174
2   3  March 23,2024    Kolkata  Hyderabad   Hyderabad    Field          208
3   4  March 24,2024  Rajasthan    Lucknow   Rajasthan      Bat          193
4   5  March 24,2024    Gujarat     Mumbai      Mumbai    Field          168

   first_wkts  second_score  second_wkts     winner player_of_the_match  \
0           6           176            4    Chennai   Mustafizur Rahman
1           9           177            6     Punjab          Sam Curran
2           7           204            7    Kolkata       Andre Russell
3           4           173            6  Rajasthan        Sanju Samson
4           6           162            9    Gujarat       Sai Sudharsan

       most_runs          most_wkts
0     Anuj Rawat  Mustafizur Rahman
1     Sam Curran      Kuldeep Yadav
2  Andre Russell        T Natarajan
3   Sanju Samson        Trent Boult
4  Dewald Brevis     Jasprit Bumrah
Delete Duplicates
In [13]:
# Make a copy of database file for safety (Data Manipulation)
In [14]:
num_rows_old = len(df)
print(f"Number of rows: {num_rows_old}")
Number of rows: 75
In [15]:
df.drop_duplicates(inplace=True)
In [16]:
num_rows_new = len(df)
print(f"Number of rows: {num_rows_new}")
Number of rows: 74
Handle Missing Values (NaN/Blank/None)
In [21]:
missing_count = df["player_of_the_match"].isnull().sum()
print(f"Missing values: {missing_count}")
Missing values: 3
In [22]:
df["player_of_the_match"].fillna(0,inplace=True)
In [23]:
missing_count = df["player_of_the_match"].isnull().sum()
print(f"Missing values: {missing_count}")
Missing values: 0
In [ ]:
df.fillna(0,inplace=True) #Fill all NaN/Blank/None values with 0
Fix Typos & Wrong Formats
In [25]:
df['team1'] = df['team1'].str.strip()
In [26]:
df['first_score'] = pd.to_numeric(df['first_score'])
Add New Columns (WinMargin)
In [27]:
df['WinMargin'] = df['first_score'] - df['second_score']
Export Clean Data
In [28]:
df.to_csv('IPL2024_Cleaned.csv', index=False)
print("Cleaned data saved successfully!")
Cleaned data saved successfully!
In [ ]: